Heeney in top 5 still.
It's awesome to see both Heeney & Jordon in career best form. Both moves have worked out soo far.
Follow along with the video below to see how to install our site as a web app on your home screen.
Note: This feature may not be available in some browsers.
 BigFooty Tipping Notice Img
Weekly Prize - Join Any Time - Tip Round 10
The Golden Ticket - MCG and Marvel Medallion Club tickets and Corporate Box tickets at the Gabba, MCG and Marvel.
Heeney in top 5 still.
It's awesome to see both Heeney & Jordon in career best form. Both moves have worked out soo far.
Is this list measured somehow in relation to the rest of their careers? If so, it isn't intrinsically a comment on how well they're playing, only about how well they're playing compared to how well they've played previously. And that could be either exciting or an indictment.
In Heeney's case arguably he has underperformed previously but fortunately he is performing so stratospherically well currently that it is not really a knock on him that he wasn't performing as well previously.
In Jordon's case it suggests that he is thriving in our environment and with selection continuity.
Actually, in almost every case it feels like a positive (probably because it is) but possibly in the case of someone like Harry McKay it does suggest that he was underperforming (which he probably wasn't when he was Coleman medallist but is probably true about last year when he had the yips).
It feels most double-edged with the players who have had the longest careers because it's tempting to think "why did it take them so long?" whereas with young players you go "of course. they're developing".
Thanks for sharing.
Ouch!
Ouch!
Its rating over the last 5 games. In that time we had a loss and a "bad win" over the Eagles.I don't understand how we can be 2nd on the table with the highest % and the be in the middle of the road graph wise.
0 | 1 | 2 | 3 | 4 | 5 | 6 | 7 | 8 | Total | |
| Bye | ||||||||||
| Isaac Heeney | 9 | 10 | 9 | 4 | 9 | 6 | 7 | 1 | 55 | |
| Errol Gulden | 5 | 6 | 9 | 2 | 5 | 7 | 34 | |||
| Chad Warner | 2 | 5 | 1 | 5 | 10 | 23 | ||||
| Nick Blakey | 5 | 9 | 5 | 19 | ||||||
| Brodie Grundy | 9 | 9 | 18 | |||||||
| Tom Papley | 7 | 7 | ||||||||
| Oliver Florent | 2 | 5 | 7 | |||||||
| Dane Rampe | 7 | 7 | ||||||||
| James Rowbottom | 5 | 5 | ||||||||
| Will Hayward | 5 | 5 | ||||||||
| Justin McInerney | 1 | 1 | ||||||||
| Logan McDonald | 1 | 1 |
 aflratings.com.au

Thanks! Great stat.G'day Swannies fans. I'm a bit of a stat head and I just thought I'd share this with you all;
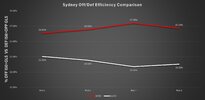
I have 25 years worth of data that shows a pretty strong correlation between a teams offensive efficiency (Inside 50s>Goals), their defensive efficiency (Defensive Inside 50s>Opposition Goals) and the differential between the two being a pretty good guide as to how strongly their game will stand up when it really matters in September.
For example; Last year the Pies Off/Eff was 25.31% whilst their Def/Eff was 20.65% which gave them a differential of +4.66 which was by far and away the best in the comp.
Similarly in 2022, the Cats led the way with a +3.17 and the Swans were 2nd with a +3.06
So far this season, Sydney have an Off/Eff of 26.59% and a Def/Eff of 19.55%, a whopping differential of +7.04 which is good for best in the league.
View attachment 1983614
Anyways, pardon the intrusion and best of luck for the rest of the season...cheers
0 | 1 | 2 | 3 | 4 | 5 | 6 | 7 | 8 | 9 | Total | |
| Bye | |||||||||||
| Isaac Heeney | 9 | 10 | 9 | 4 | 9 | 6 | 7 | 1 | 8 | 63 | |
| Errol Gulden | 5 | 6 | 9 | 2 | 5 | 6 | 33 | ||||
| Chad Warner | 2 | 5 | 1 | 5 | 10 | 5 | 28 | ||||
| Nick Blakey | 5 | 9 | 5 | 19 | |||||||
| Brodie Grundy | 9 | 9 | 18 | ||||||||
| Oliver Florent | 2 | 5 | 8 | 15 | |||||||
| Tom Papley | 7 | 7 | |||||||||
| Dane Rampe | 7 | 7 | |||||||||
| James Rowbottom | 5 | 5 | |||||||||
| Will Hayward | 5 | 5 | |||||||||
| James Jordon | 3 | 3 | |||||||||
| Justin McInerney | 1 | 1 | |||||||||
| Logan McDonald | 1 | 1 |
We've also had some close games until the final quarter, so players from the opposition did well for most of itAdding up your totals I conclude that collectively we have won 205/360 (= 57%) coaches votes on offer.
I'm slightly surprised it's not more. I guess we had 2.5 shaky performances.
