Remove this Banner Ad

Analysis Season 2025 - Statistics and Analytics Thread

🥰 Love BigFooty? Join now for free.

Log in to remove this Banner Ad

I have a stat.

If you add up all the deficits we've overcome during our current 10 game winning streak, it adds up to 205.

I had a look at the longest winning streaks on afltables and couldn't find anything greater. Our 2001-2 team that went on a 20 game winning streak had deficits in those 20 games totalling 202 points. Interestingly, Collingwood's 2022 team which went on that enthralling 11 game winning streak, only totals 192 points.

So I don't know if our current team holds the record but I haven't been able to find a bigger one!
 
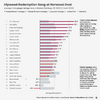
CD generated ranking points, explained in full in this doc:


I think they are very good at measuring contribution with the ball, but obviously really can’t measure off ball contribution such as keeping an opponent quiet. Still a useful metric to measure impact on a game beyond just raw disposals etc.
I've no issue with the data, just wondering how you get access to them. Must be handy to have access to CD data, I'm a bit envious
 
I've no issue with the data, just wondering how you get access to them. Must be handy to have access to CD data, I'm a bit envious
The fitzRoy API is in the public domain. It's not the full champion data set, but it has a HEAP of stuff. This is where I get all the data for the blog posts I write on my website, including the player ratings.

You'll need to be a bit handy with R, but it's not that difficult if you're a bit technical. I'm more than happy to show you a few tricks if you're keen (just yell out). I actually wrote a beginner focused 'how to' here.

I think they are very good at measuring contribution with the ball, but obviously really can’t measure off ball contribution such as keeping an opponent quiet

Pretty much. There is an excellent explainer posted on the AFL subreddit a few months back.

Edit: updated the link to the beginner fitzRoy tutorial
 
Last edited:
I've no issue with the data, just wondering how you get access to them. Must be handy to have access to CD data, I'm a bit envious

You can access it on the afl website on a per game basis on a computer in the stats section. It takes a while to find it. I can’t get it to work on my afl app.

In classic CD/AFL fashion the player ratings were developed for a phd thesis and there used to be a social media post on twitter to provide game by game highlights, compare players at a similar age on player ratings and etc. that phd finished and cd discontinued the comms for it!
 
I work in IT and have some programming skills but I've never used R before. I must look into it.

I do quite a lot of R and it's awesome for this sort of stuff. The API is very easy to use, so anyone with any programming skills should be able to easily get it going. Also bonus R and Rstudio are (mostly) open source, so no real cost to the hobbiest afl statistics analyst!

there used to be a social media post on twitter to provide game by game highlights, compare players at a similar age on player ratings and etc. that phd finished and cd discontinued the comms for it!
Actually there is someone who posts the full ratings of each game on BlueSky after each game! Maybe thats who you are referring too? https://bsky.app/profile/aflplayerratings.bsky.social
 

Remove this Banner Ad

I do quite a lot of R and it's awesome for this sort of stuff. The API is very easy to use, so anyone with any programming skills should be able to easily get it going. Also bonus R and Rstudio are (mostly) open source, so no real cost to the hobbiest afl statistics analyst!


Actually there is someone who posts the full ratings of each game on BlueSky after each game! Maybe thats who you are referring too? https://bsky.app/profile/aflplayerratings.bsky.social
Followed
 
I do quite a lot of R and it's awesome for this sort of stuff. The API is very easy to use, so anyone with any programming skills should be able to easily get it going. Also bonus R and Rstudio are (mostly) open source, so no real cost to the hobbiest afl statistics analyst!


Actually there is someone who posts the full ratings of each game on BlueSky after each game! Maybe thats who you are referring too? https://bsky.app/profile/aflplayerratings.bsky.social

That's great! It looks a bit like it used to on twitter.


What is also missing is the weekly update on relative ratings by age group etc that you used to get, e.g.

 
Hoyney following the lead of a lot of the advanced models by pointing out our issues despite winning:

#10 for points from turnover, #9 for points against. Being carried by accuracy and the clearance work to an extent - total opposite of last year.

And that in itself defies logic. We are not winning games the way good teams should be winning them, let alone doing so from being behind. Bodes very, very well for when we DO get our turnover game going.
 

🥰 Love BigFooty? Join now for free.

Hoyney following the lead of a lot of the advanced models by pointing out our issues despite winning:

#10 for points from turnover, #9 for points against. Being carried by accuracy and the clearance work to an extent - total opposite of last year.
The problem is that our bad periods in games are longer than our good.
So the stats are largely in favour of our periods when we are not so good.
It will balance out over time, especially when we string some more consistency together.
 
And that in itself defies logic. We are not winning games the way good teams should be winning them, let alone doing so from being behind. Bodes very, very well for when we DO get our turnover game going.

Other thing I'm pondering is that we might end up trailing in those metrics longer because we didn't put the foot down on the eagles and tigers. Everyone else is going to rack up numbers against the bottom teams, and we have already had two of our games against last years bottom 6.

Regardless, our ability to punish is way way down. We are doing it on quantity (volume of inside 50s and scoring chains) but our forward 50 is doing way less. Need to get healthy and work out some better method to apply more consistently.

Currently averaging more in the first 5 rounds than we did last year, too.

Final form Flagbane will be scary.
 
First change to the seedings for the season!

#1 Hawthorn (1059) - had the bye.

#2 Geelong (784) - basically had the bye. You know how well Melbourne are going when your 40 point win was basically "expected".

#3 Brisbane (663) - worst performing team of the round relative to expectations!

#4 Greater Western Sydney (604) - they finally break in after a pretty impressive start to the season, gaining 101 points in their flogging of West Coast.

The Bulldogs slip back to #6 on 452 rating points, after the model had them beating Freo by a couple of goals.

The biggest gains on the weekend were Richmond (+130) despite losing, Fremantle (+110) and the Giants as above.

The model has us beating the Dogs by 6 points this week.
No changes to the seedings this week but the gaps have certainly closed up!

#1 Hawthorn (834) - were expected to win comfortably against Port. Instead they got cleaned up, and the model only accounts for the final margin, not the smashing they got in the first half. Their 225 swing against is the largest of the season so far.

#2 Geelong (814) - slight overperformance against the Crows.

#3 Brisbane (720) - slightly larger overperformance against the Bulldogs, but not enough to pass the Cats.

#4 Greater Western Sydney (667) - similar scale of overperformance against the Saints.

The best performances from the round were Port (+225), Collingwood (+124 against Sydney), Essendon (+117 v Melbourne) and Carlton (+110 v West Coast). Interestingly with Carlton and Port's strong showings over the weekend, there are now 13 of the 18 teams who have a positive rating. All the ratings add up to 0 so that gives you an indication of how the bottom sides are faring.

The model has us beating Collingwood by 5 points on Thursday night. I know various models have attempted over the years to account for 5 day breaks etc etc, but given each team has relatively few of them each year, it's very difficult to account for with any great accuracy. Hopefully it doesn't adversely affect us this week! 🤞
 
I'm probably not the person to be commenting on this but just as an observation there have been thousands of ratings models for racehorses over the years and unless you do your own incisive homework you bet using any one of them consistently and you lose.

All of these things are a guide only as to what the real state of play is imo.

The really detailed stats are fun to play around with but unless you have the capacity to analyse each and every play as to what actually occurred they can be misleading.

The idea in footy is to get the ball and execute when you get it or prevent the opposition from executing when they get it.

The relative importance of when and the impact of particular passages or singular plays is very hard to quantify.

It's a good sign when teams dig deep under pressure . Collingwood was showing that for a couple of years and went on to win a flag. We've been doing it for almost a year and a half now.
 

Remove this Banner Ad

Analysis Season 2025 - Statistics and Analytics Thread


Write your reply...

Remove this Banner Ad

🥰 Love BigFooty? Join now for free.

Back
Top