Coach Sam Mitchell's direction for the club and 2024 news

Remove this Banner Ad

If anyone wants to have a listen about what the data is saying in regards to whether we have actually gotten worse this year have a listen to this from the 9:15 mark.

I know a few people have already touched on it, but the data is also showing that our results this year have been slightly better despite actually putting out a younger team and dealing with some injuries.


And here.
 
I was going to add it's also 4 of the top 5 if you include Essendon, but I can see why you wouldn't. They've had such a soft draw. They have only played two top 8 sides so far and haven't got close. And even a few of their wins against bottom sides haven't been that convincing.

We really should have beaten them.
I think Essendon have won expected score once this year lol
 
Yet we have conceded the second highest mumber of points against YTD.
Sure it looks like improvement but the ladder says otherwise.
Im working on something to show this statistically v the same period last year. Eyeballing the raw numbers suggests we are better defensively but not good. Still below average. One of the worst in the comp as you would expect.
 
Im working on something to show this statistically v the same period last year. Eyeballing the raw numbers suggests we are better defensively but not good. Still below average. One of the worst in the comp as you would expect.

Right now the stats that show we have improved feel a bit like my mum saying I am handsome but the pretty girls still won't go out with me.

The real stats that matter are PF and PA.
 

Log in to remove this ad.

Right now the stats that show we have improved feel a bit like my mum saying I am handsome but the pretty girls still won't go out with me.

The real stats that matter are PF and PA.
Yeah, I think a few of us probably want a bit more in the analysis than “win = good, loss = bad”. 😂
 
Right now the stats that show we have improved feel a bit like my mum saying I am handsome but the pretty girls still won't go out with me.

The real stats that matter are PF and PA.

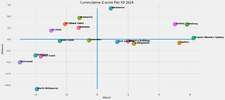
Here is a rough and ready go at it:
This is how we rank in performance controlling for the strength of our opponent (measured over the 12 months prior to each round). Not the worst! (don't worry about the scale, its not standardised yet and has no real meaning outside the chart)

You can see that even though Essendon have 5 wins from 8 games, they are just below average defensively and offensively. Their record reflects the relative weakness of their opponents. Note, this measure rates GC as a just below average defence and below average attack. We made them look like world beaters :(

Geelong, Sydney, GWS and Dees the only clubs to have above average attack and defence.
1715161666369.png

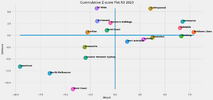
If we go back a year, we did tend to look like the worst team in the comp...

1715162206190.png

Now for a more technical view of the season...

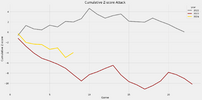
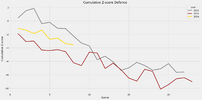
This charts the path of our performance relative to the strength of our opposition. If the line moves down from round to round we are performing below average, if it moves up, we performed above average, and if it stays horizontal it means we are right on average relative to the rest of the league v our opponent.

In 2022 we had an above average attack for most of the year (at least the first half before we trended back to average). In 2023 that fell apart early but you cans that after about game 8 or 9 the trend is approximately horizontal, which means we were around average, with some fluctuations up and down. You can see the line move up in the game v North (game 6) and the dogs (game 8) meaning we were above average in those games.
1715165540645.png

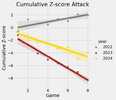
This chart plots the trend in the first game. Once again, down = below average, up = above average and horizontal = average. You can see the slope of 2024 is closer to horizontal than 2023, meaning it is closer to average i.e. it is an improvement on the form of the same period last year but maybe a regression if we compare it to the broad trend in the second half of 2023.
1715164760506.png

This chart shows that for the past 2.5 seasons we have been below average. We don't really see a flattening out of the defensive scores like we saw above suggesting we didn't make as big of an improvement on defence as we did in attack. You can see the line moves up in 2024 in game 4 v Pies and game 6 v North. Note, not against the dogs. In 2023, defensive over average performance was more often correlated with winning than offensive over performance (relative to the league v our opponent). We really should have beat the pies!

1715165558372.png
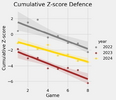
As you can see, the 8 game trend suggests there is not a lot of difference between any of the years. Maybe there is a slight improvement there but it may not be statistically significant. I'll develop a test for this at some point but it doesn't easily pass the eye test, which is what we are really looking for here.
1715165005660.png

Verdict: improvement relative to last year is detectable in attack with maybe a slight improvement in defence. Given the injuries we have had, been better than the same stage last year is a big plus all said and done.
 
Here is a rough and ready go at it:
This is how we rank in performance controlling for the strength of our opponent (measured over the 12 months prior to each round). Not the worst! (don't worry about the scale, its not standardised yet and has no real meaning outside the chart)

You can see that even though Essendon have 5 wins from 8 games, they are just below average defensively and offensively. Their record reflects the relative weakness of their opponents. Note, this measure rates GC as a just below average defence and below average attack. We made them look like world beaters :(

Geelong, Sydney, GWS and Dees the only clubs to have above average attack and defence.
View attachment 1983152

If we go back a year, we did tend to look like the worst team in the comp...

View attachment 1983161

Now for a more technical view of the season...

This charts the path of our performance relative to the strength of our opposition. If the line moves down from round to round we are performing below average, if it moves up, we performed above average, and if it stays horizontal it means we are right on average relative to the rest of the league v our opponent.

In 2022 we had an above average attack for most of the year (at least the first half before we trended back to average). In 2023 that fell apart early but you cans that after about game 8 or 9 the trend is approximately horizontal, which means we were around average, with some fluctuations up and down. You can see the line move up in the game v North (game 6) and the dogs (game 8) meaning we were above average in those games.
View attachment 1983221

This chart plots the trend in the first game. Once again, down = below average, up = above average and horizontal = average. You can see the slope of 2024 is closer to horizontal than 2023, meaning it is closer to average i.e. it is an improvement on the form of the same period last year but maybe a regression if we compare it to the broad trend in the second half of 2023.
View attachment 1983203

This chart shows that for the past 2.5 seasons we have been below average. We don't really see a flattening out of the defensive scores like we saw above suggesting we didn't make as big of an improvement on defence as we did in attack. You can see the line moves up in 2024 in game 4 v Pies and game 6 v North. Note, not against the dogs. In 2023, defensive over average performance was more often correlated with winning than offensive over performance (relative to the league v our opponent). We really should have beat the pies!

View attachment 1983223
As you can see, the 8 game trend suggests there is not a lot of difference between any of the years. Maybe there is a slight improvement there but it may not be statistically significant. I'll develop a test for this at some point but it doesn't easily pass the eye test, which is what we are really looking for here.
View attachment 1983211

Verdict: improvement relative to last year is detectable in attack with maybe a slight improvement in defence. Given the injuries we have had, been better than the same stage last year is a big plus all said and done.

The improvement in attack is also impressive given how many new players we are rolling through there. Chol, Ginnivan, Watson, Dear, Maginness & Hardwick are all either new recruits or new to the position. It takes time for things to gel and could be the sign of a potent forward mix on the horizon.
 
Here is a rough and ready go at it:
This is how we rank in performance controlling for the strength of our opponent (measured over the 12 months prior to each round). Not the worst! (don't worry about the scale, its not standardised yet and has no real meaning outside the chart)

You can see that even though Essendon have 5 wins from 8 games, they are just below average defensively and offensively. Their record reflects the relative weakness of their opponents. Note, this measure rates GC as a just below average defence and below average attack. We made them look like world beaters :(

Geelong, Sydney, GWS and Dees the only clubs to have above average attack and defence.
View attachment 1983152

If we go back a year, we did tend to look like the worst team in the comp...

View attachment 1983161

Now for a more technical view of the season...

This charts the path of our performance relative to the strength of our opposition. If the line moves down from round to round we are performing below average, if it moves up, we performed above average, and if it stays horizontal it means we are right on average relative to the rest of the league v our opponent.

In 2022 we had an above average attack for most of the year (at least the first half before we trended back to average). In 2023 that fell apart early but you cans that after about game 8 or 9 the trend is approximately horizontal, which means we were around average, with some fluctuations up and down. You can see the line move up in the game v North (game 6) and the dogs (game 8) meaning we were above average in those games.
View attachment 1983221

This chart plots the trend in the first game. Once again, down = below average, up = above average and horizontal = average. You can see the slope of 2024 is closer to horizontal than 2023, meaning it is closer to average i.e. it is an improvement on the form of the same period last year but maybe a regression if we compare it to the broad trend in the second half of 2023.
View attachment 1983203

This chart shows that for the past 2.5 seasons we have been below average. We don't really see a flattening out of the defensive scores like we saw above suggesting we didn't make as big of an improvement on defence as we did in attack. You can see the line moves up in 2024 in game 4 v Pies and game 6 v North. Note, not against the dogs. In 2023, defensive over average performance was more often correlated with winning than offensive over performance (relative to the league v our opponent). We really should have beat the pies!

View attachment 1983223
As you can see, the 8 game trend suggests there is not a lot of difference between any of the years. Maybe there is a slight improvement there but it may not be statistically significant. I'll develop a test for this at some point but it doesn't easily pass the eye test, which is what we are really looking for here.
View attachment 1983211

Verdict: improvement relative to last year is detectable in attack with maybe a slight improvement in defence. Given the injuries we have had, been better than the same stage last year is a big plus all said and done.
Amazing mate. Lots of work in that. Thanks for sharing.
 
Here is a rough and ready go at it:
This is how we rank in performance controlling for the strength of our opponent (measured over the 12 months prior to each round). Not the worst! (don't worry about the scale, its not standardised yet and has no real meaning outside the chart)

You can see that even though Essendon have 5 wins from 8 games, they are just below average defensively and offensively. Their record reflects the relative weakness of their opponents. Note, this measure rates GC as a just below average defence and below average attack. We made them look like world beaters :(

Geelong, Sydney, GWS and Dees the only clubs to have above average attack and defence.
View attachment 1983152

If we go back a year, we did tend to look like the worst team in the comp...

View attachment 1983161

Now for a more technical view of the season...

This charts the path of our performance relative to the strength of our opposition. If the line moves down from round to round we are performing below average, if it moves up, we performed above average, and if it stays horizontal it means we are right on average relative to the rest of the league v our opponent.

In 2022 we had an above average attack for most of the year (at least the first half before we trended back to average). In 2023 that fell apart early but you cans that after about game 8 or 9 the trend is approximately horizontal, which means we were around average, with some fluctuations up and down. You can see the line move up in the game v North (game 6) and the dogs (game 8) meaning we were above average in those games.
View attachment 1983221

This chart plots the trend in the first game. Once again, down = below average, up = above average and horizontal = average. You can see the slope of 2024 is closer to horizontal than 2023, meaning it is closer to average i.e. it is an improvement on the form of the same period last year but maybe a regression if we compare it to the broad trend in the second half of 2023.
View attachment 1983203

This chart shows that for the past 2.5 seasons we have been below average. We don't really see a flattening out of the defensive scores like we saw above suggesting we didn't make as big of an improvement on defence as we did in attack. You can see the line moves up in 2024 in game 4 v Pies and game 6 v North. Note, not against the dogs. In 2023, defensive over average performance was more often correlated with winning than offensive over performance (relative to the league v our opponent). We really should have beat the pies!

View attachment 1983223
As you can see, the 8 game trend suggests there is not a lot of difference between any of the years. Maybe there is a slight improvement there but it may not be statistically significant. I'll develop a test for this at some point but it doesn't easily pass the eye test, which is what we are really looking for here.
View attachment 1983211

Verdict: improvement relative to last year is detectable in attack with maybe a slight improvement in defence. Given the injuries we have had, been better than the same stage last year is a big plus all said and done.
Mate this is just top notch. Great effort. Love it
 
Here is a rough and ready go at it:
This is how we rank in performance controlling for the strength of our opponent (measured over the 12 months prior to each round). Not the worst! (don't worry about the scale, its not standardised yet and has no real meaning outside the chart)

You can see that even though Essendon have 5 wins from 8 games, they are just below average defensively and offensively. Their record reflects the relative weakness of their opponents. Note, this measure rates GC as a just below average defence and below average attack. We made them look like world beaters :(

Geelong, Sydney, GWS and Dees the only clubs to have above average attack and defence.
View attachment 1983152

If we go back a year, we did tend to look like the worst team in the comp...

View attachment 1983161

Now for a more technical view of the season...

This charts the path of our performance relative to the strength of our opposition. If the line moves down from round to round we are performing below average, if it moves up, we performed above average, and if it stays horizontal it means we are right on average relative to the rest of the league v our opponent.

In 2022 we had an above average attack for most of the year (at least the first half before we trended back to average). In 2023 that fell apart early but you cans that after about game 8 or 9 the trend is approximately horizontal, which means we were around average, with some fluctuations up and down. You can see the line move up in the game v North (game 6) and the dogs (game 8) meaning we were above average in those games.
View attachment 1983221

This chart plots the trend in the first game. Once again, down = below average, up = above average and horizontal = average. You can see the slope of 2024 is closer to horizontal than 2023, meaning it is closer to average i.e. it is an improvement on the form of the same period last year but maybe a regression if we compare it to the broad trend in the second half of 2023.
View attachment 1983203

This chart shows that for the past 2.5 seasons we have been below average. We don't really see a flattening out of the defensive scores like we saw above suggesting we didn't make as big of an improvement on defence as we did in attack. You can see the line moves up in 2024 in game 4 v Pies and game 6 v North. Note, not against the dogs. In 2023, defensive over average performance was more often correlated with winning than offensive over performance (relative to the league v our opponent). We really should have beat the pies!

View attachment 1983223
As you can see, the 8 game trend suggests there is not a lot of difference between any of the years. Maybe there is a slight improvement there but it may not be statistically significant. I'll develop a test for this at some point but it doesn't easily pass the eye test, which is what we are really looking for here.
View attachment 1983211

Verdict: improvement relative to last year is detectable in attack with maybe a slight improvement in defence. Given the injuries we have had, been better than the same stage last year is a big plus all said and done.
how do the actual numbers work? that deem average, our performance. are you sourcing them, or are you making them based on an algorithm using PF/PA etc.
 
That pod had me go look at some things.

In the last 5 games we are :

3rd in the comp for Contested Possesion differential(behind Carlton and Brisbane).

4th in the comp for Intercept Possession differential(Coll, Geel, Giants)

1st in the comp for Groundball gets differential as they stated. The 6th best side in this metric after 8 rounds since CD started.
And every single side he mentioned as good at this metric were top sides.

After 8 rounds since CD started 25 years ago in 1999.

Winning contests in general play.
Essendon 2000 - +124 (flag)
Geelong 2009 - +111 (flag)
Collingwood 2011 - +98 (runners up)
West Coast 2003 - +97 (7th go onto win the flag within 2-3 years)
Geelong 2020 - +93 (runners up)

And finally Hawthorn of 2024 at +91 which is incredible.

The next best side in 2024 is +35 it’s insane to think of that gap.


As he also mentioned the defensive game has gone from 16th at defending ball movement to now 3rd. Went from ping pong to this. As you mentioned also with the intercept game, and when Hawthorn play well the pressure is up and causes poor kicks for opposition going forward to the high press.

There’s a clear DNA, a clear structure and this is the way the game is headed. Tactical and strategic but winning contests, backing the midfield, we had that last year. Winning contest in general play and defending ball movement to create turnovers, and high pressure (when this happens tend to play well). This opens avenue to score from ball movement which is a strength, scoring from turnover and stoppages. Which last year Hawthorn did score a lot from stoppage once the game got going middle and late in the season.

It’s an exciting time.
 
how do the actual numbers work? that deem average, our performance. are you sourcing them, or are you making them based on an algorithm using PF/PA etc.
The numbers on the chart dont have much meaning right now. But the underlying measure is a comparison between our performance (for and against) compared with the performances of all the teams that played against our opponent in the last year. Still work to be done to refine it and make it easier to follow but it seems to do ok broadly as a way to track form. Its not designed to be a bookie buster or even a premier predictor. Just a way to observe form.
 
The numbers on the chart dont have much meaning right now. But the underlying measure is a comparison between our performance (for and against) compared with the performances of all the teams that played against our opponent in the last year. Still work to be done to refine it and make it easier to follow but it seems to do ok broadly as a way to track form. Its not designed to be a bookie buster or even a premier predictor. Just a way to observe form.
It's brilliant. Thank you !
 

(Log in to remove this ad.)

And every single side he mentioned as good at this metric were top sides.

After 8 rounds since CD started 25 years ago in 1999.

Winning contests in general play.
Essendon 2000 - +124 (flag)
Geelong 2009 - +111 (flag)
Collingwood 2011 - +98 (runners up)
West Coast 2003 - +97 (7th go onto win the flag within 2-3 years)
Geelong 2020 - +93 (runners up)

And finally Hawthorn of 2024 at +91 which is incredible.

The next best side in 2024 is +35 it’s insane to think of that gap.


As he also mentioned the defensive game has gone from 16th at defending ball movement to now 3rd. Went from ping pong to this. As you mentioned also with the intercept game, and when Hawthorn play well the pressure is up and causes poor kicks for opposition going forward to the high press.

There’s a clear DNA, a clear structure and this is the way the game is headed. Tactical and strategic but winning contests, backing the midfield, we had that last year. Winning contest in general play and defending ball movement to create turnovers, and high pressure (when this happens tend to play well). This opens avenue to score from ball movement which is a strength, scoring from turnover and stoppages. Which last year Hawthorn did score a lot from stoppage once the game got going middle and late in the season.

It’s an exciting time.

Didn't 3/4 of this board have Sam sacked this year?

He's been so good. I love the guy and it reminds me of 2006-07.

The voice we needed
 
Yet we have conceded the second highest mumber of points against YTD.
Sure it looks like improvement but the ladder says otherwise.
Teams have kicked 117.67 against us. We have conceded the same amount of scoring shots as GWS who have conceded 93.91. It is a 120 point difference just on accuracy

Some of that is poor defense a fair bit of that is luck. We have seen plenty of games against us where teams are just nailing tough shots
And with our ravaged backline, i think this could be expected.

Add Blanck, DGB, McCabe over the next 18 months and we're sweet ;)
 
And with our ravaged backline, i think this could be expected.

Add Blanck, DGB, McCabe over the next 18 months and we're sweet ;)
And who are they replacing in the current team? It will be a hard sell that any of those guys are in the team in 18 months, maybe one will replace Frost (+33yo) but he's as professional as they come so he'll be fighting tooth and nail to keep his spot. All 3 are KPD so its Frost, Sic, Scrimshaw and Weddle they are up against
 
Teams have kicked 117.67 against us. We have conceded the same amount of scoring shots as GWS who have conceded 93.91. It is a 120 point difference just on accuracy

Some of that is poor defense a fair bit of that is luck. We have seen plenty of games against us where teams are just nailing tough shots
No other team has had as many long range shots kicked against it.

From a week or two ago.

 
So 8 of our remaining games are against teams outside of the top 8 currently, with 7 of those against teams outside the top 10.

Unlikely we make the 8, but how many do we win from here?
I found it amusing that the commentators claimed that the saints season was on the line and yet after winning, our season was very much alive…we are on the same wins as the saints with far worse percentage 😂

So i guess we are still in with a chance at the 8 😂

#9winstogo
 
Last edited:
So 8 of our remaining games are against teams outside of the top 8 currently, with 7 of those against teams outside the top 10.

Unlikely we make the 8, but how many do we win from here?
Will depend on the fitness of our list. Need to get players back into our spine.

If we do that I feel we can continue to cause some upsets.
 

Remove this Banner Ad

Back
Top