Stats observations

Remove this Banner Ad

Just found by accident that 2 of the 4 lowest team clearance counts in a single game!

Melbourne v Fremantle, Rd1 1998 just 15.
Fremantle v Melbourne, Rd1 1998 just 5.

Surely that can't be right? Maybe they counted them differently

In a similar vein, the two lowest possession counts ever recorded are from this North Melbourne vs South Melbourne game in round 1, 1965:


I was thinking there might have been some difference with how stats were recorded in those early days, and that's a possibility given that 20 of the 40 lowest possession counts appeared in the 1965 and 1966 seasons, but that might also just be a function of the game being played differently in those days. But it's still difficult to account for the fact that North managed a full 30 possessions less than any team in history during a game in which their opponents collected what would otherwise have been the lowest possession count in history in its own right.

I tried to find some info on the game, and the records suggest that it was played in wet weather, but otherwise no other mention of anything unusual. Incredibly, Bob Skilton recorded 37 possessions in this game, meaning that he was responsible for about 11% of the total possessions recorded by both teams, which itself must be a record.
 
Was perusing AFL Tables, and checked Mitch Duncan's career stats, as i had been following his win tally, with Geelong's win over the Lions notching his 200th victory.

But i am quite staggered that in a 279 game career, he's played 26 games against Hawthorn, but if he plays the Blues this weekend, it will be just his 12th game against them. For such a long career, that's quite a discreptancy! Aside from players on Derby sides, doubt too many others would have numbers like that differential.
 

Log in to remove this ad.

Was perusing AFL Tables, and checked Mitch Duncan's career stats, as i had been following his win tally, with Geelong's win over the Lions notching his 200th victory.

But i am quite staggered that in a 279 game career, he's played 26 games against Hawthorn, but if he plays the Blues this weekend, it will be just his 12th game against them. For such a long career, that's quite a discreptancy! Aside from players on Derby sides, doubt too many others would have numbers like that differential.


amazing numbers and amazing win rate.

goes to show the uneveness in the fixturing.

no doubt geelong and hawthorn have plated each other twice a year on a number of occasions since the renewed rivalry after 2008. they would've also met in finals a few times as well, whereas carlton haven't been around finals for a while.

perhaps he also missed the odd game or 2 v carlton thru injury when fixtured against them.
 
In a similar vein, the two lowest possession counts ever recorded are from this North Melbourne vs South Melbourne game in round 1, 1965:


I was thinking there might have been some difference with how stats were recorded in those early days, and that's a possibility given that 20 of the 40 lowest possession counts appeared in the 1965 and 1966 seasons, but that might also just be a function of the game being played differently in those days. But it's still difficult to account for the fact that North managed a full 30 possessions less than any team in history during a game in which their opponents collected what would otherwise have been the lowest possession count in history in its own right.

I tried to find some info on the game, and the records suggest that it was played in wet weather, but otherwise no other mention of anything unusual. Incredibly, Bob Skilton recorded 37 possessions in this game, meaning that he was responsible for about 11% of the total possessions recorded by both teams, which itself must be a record.

Almost certainly the methodology changed. I'm curious as to where AFL Tables etc. sourced their pre-1999 data (1999 being the year that Champion Data came on board).

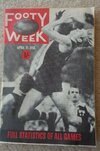
I'm guessing the 1965 era stuff came from Footy Week. This particular issue below would probably contain the answer.

Footy Week.jpg

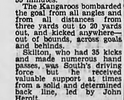
Interestingly, the Age report from the following day claims that Skilton had 35 kicks, so maybe they had their own statisticians? Or perhaps they were counting kick-ins from behinds...

Screenshot 2024-04-25 23.35.40.png
 
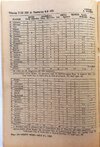
I managed to find an example of how a stats sheet looked in Footy Week during 1965. This is from the Round 13 game between Fitzroy and Footscray.

FW Stats.jpg

The numbers match up with what's on AFL Tables, which is no surprise. But what's fascinating to me is the data that's been left behind – stuff like kicking efficiency, handball efficiency, location of free kicks, stoppage counts, and entirely missed shots on goal.

To be fair, AFL Tables doesn't display any of those stats even for 2024 games, but it would certainly all be being kept by Champion Data, and all stored somewhere.

I love the little stories it tells though. Like how the Dogs received 20 free kicks inside half-forward but only managed 6 goals. Or how Ted Whitten had 18 disposals at 100% efficiency by hand and foot. Or you might think that Wayne Eastman was one of the best on ground given his 20 kicks, but only 40% of his kicks were effective.

This is stuff that needs to be kept and treasured.
 
Chris Scott now has seven actual runs of seven wins in a row (and if I can channel Rogers results here) it would be 24 times of seven wins in a row when you factor in the 13 games he started with, the 16 in a row in the 2022 Flag run, and two runs of 8 in a row.

So it's three actual 7's in a row including today's, two 8 in a row which is 2 x 2 runs of 7, seven 7's in a row for the 13-0 start in 2011, and 10 7's in a row for the 16 in a row in 2022.

Wouldn't be too many other coaches who could claim that sort of success with winning runs of seven or more?
 
Last edited:
Bailey Scott now has the 5th worst win/loss percentage for any player (who's played min 50 games) in VFL/AFL history (worst since WW2).
 
Last edited:
In a similar vein, the two lowest possession counts ever recorded are from this North Melbourne vs South Melbourne game in round 1, 1965:


I was thinking there might have been some difference with how stats were recorded in those early days, and that's a possibility given that 20 of the 40 lowest possession counts appeared in the 1965 and 1966 seasons, but that might also just be a function of the game being played differently in those days. But it's still difficult to account for the fact that North managed a full 30 possessions less than any team in history during a game in which their opponents collected what would otherwise have been the lowest possession count in history in its own right.

I tried to find some info on the game, and the records suggest that it was played in wet weather, but otherwise no other mention of anything unusual. Incredibly, Bob Skilton recorded 37 possessions in this game, meaning that he was responsible for about 11% of the total possessions recorded by both teams, which itself must be a record.
It’s possible that the game was unusually short given the very wet conditions. 47 points was the highest score of six games that extremely wet Easter Monday, yet for a full round since 1920 there has never been a lower highest score than 65 points. The disposal totals for the MCG game the same day are only slightly higher, which adds support to my conclusion, although the infamous Kardinia Park game where only one behind was scored in the first quarter and Geelong kicked its lowest winning score since 1902 had more “normal” disposal totals. I wonder if this is due to differences in style — news reports of the Kardinia Park game did say Footscray tried to maintain a lead with a possession game in the last quarter.
 
Premiers to wooden spoon:
Bambill (Millewa FL) — 2016-2017 (coming off a threepeat)
Barossa District (Barossa Light & Gawler FL) — 2013-2014
Benambra (Omeo District FL) — 1994-1995, 2000-2001
Calingiri (Mortlock FL) — 2015-2016
Cobdogla (Riverland Independent FL) — 2001-2002
Cudgewa (Upper Murray FL) — 2000-2001
Donald (North Central FL) — 2006-2007
Esperance (Esperance DFL) — 2001-2002
Federals (Upper Murray FL) — 2007-2008
Hamley Bridge (Adelaide Plains FL) — 2014-2015
Jamestown/Peterborough (Northern Areas FA) — 2004-2005 (four spoons in a row after back-to-back premierships)
Loxton North (Riverland FL A Grade) — 2004-2005
Millicent (Western Border FL) — 2018-2019
Mullewa (Great Northern FL) — 2017-2018 (four spoons in a row)
Newcomb (Bellarine FL) — 2007-2008 (did not finish above second last until 2019)
Newtown/Condingup (Esperance DFL) — 2022-2023
Orbost (East Gippsland FL) — 1996-1997
Portarlington (Bellarine FL) — 1994-1995
Ports (Esperance DFL) — 2019-2020
Renmark (Riverland FL A Grade) — 2009-2010
Southern Flinders (Northern Areas FA) — 2013-2014
Wisanger (Kangaroo Island FL) — 2005-2006 (four spoons in a row)

The Northern Areas FA 2013-2014 and Mortlock FL 2015-2016 seasons are the only ones I've found in recent times where the premiers and wooden spooners switched places.
That actually happened in the SANFL in 1934 and 1935. There is, apart from Glenelg in those two seasons, only one other case of a club falling from a premiership to a wooden spoon in the V/AFL, SANFL or WA(N)FL, and that was Subiaco as far back as 1915 and 1916, a period of course affected by World War One. It also happened to Oakleigh in the VFA in 1931 and 1932, and again financial issues were undoubtedly a factor, as the club was struggling to pay its players and lost several key personnel before the 1932 season at the height of the Depression.
 
I can't remember who talked about prime numbers here to inspire this but:

  • There have been 69 prime number games in the AFL. A "prime number game" is one where the scoreboard is entirely prime numbers.
  • The first one was Fitzroy 5.13.43 drew South Melbourne 5.13.43 in Round 7, 1897.
  • The most recent one was Sydney 13.11.89 def by Brisbane 17.11.113 in Round 7, 2022.
  • The only Grand Final was in 1990: Collingwood 13.11.89 def Essendon 5.11.41. Two other finals have been prime number games: The semi final between Geelong and St. Kilda in 1968, and the qualifying final between Essendon and Richmond in 2001
  • The lowest achievable prime number score is 2.5.17, but the lowest achieved in a prime number game has been 3.5.23 and 2.11.23 on five occasions.
  • The highest score in a prime number game was Geelong's 37.11.233 to Melbourne's 7.5.47 in Round 19, 2011. The next highest is merely 23.13.151, achieved three times.
  • Six prime number games were draws: Fitzroy vs South Mebourne in 1897, North Melbourne vs Fitzroy in 1933, North Melbourne vs Geelong in 1961, North Melbourne vs Hawthorn in 1985, Carlton vs Essendon in 2011, and Gold Coast vs Essendon in 2020.
  • Round 11, 1985 was the only time in history where there were multiple prime number games. North Melbourne drew Hawthorn and Essendon defeated Sydney. Unfortunately, they were on different days, so no two prime number games have been on the same day.
  • The longest wait between prime number games was ten years, between 1933 and 1943.
A "round prime number game" means the round is also a prime number. This has happened 31 times.

A "true prime number game" means that not only are the scores and round prime numbers, but even the day, month and year are prime numbers. This has not happened, but 2 out of 3 components of the date were prime on three occasions:

13/7/1929, Round 11: Hawthorn 5.13.43 def by Melbourne 7.11.53 — Unfortunately, 1929 is a product of 3 and 643.
27/5/1933, Round 5: St Kilda 13.19.97 def North Melbourne 11.17.83 — Unfortunately, 27 is a product of 3 and 9.
13/5/1961, Round 5, North Melbourne 11.17.83 def Carlton 17.7.109 — Unfortunately, 1961 is a product of 37 and 53.

Don't expect any true ones this year.
One other numerical thing I have noted but not discussed is game scores that are best rational approximations of irrational numbers.

The fraction 99/70 is well known as a best rational approximation of the square root of 2. There have been nine “root 2 games”:

31933Melbourne4.1 (25)7.4 (46)11.6 (72)15.9 (99)Essendon2.3 (15)5.4 (34)7.8 (50)10.10 (70)
151938South Melbourne3.3 (21)5.10 (40)5.12 (42)9.16 (70)Melbourne5.5 (35)7.6 (48)10.11 (71)14.15 (99)
161966Carlton6.5 (41)9.8 (62)12.13 (85)14.15 (99)Melbourne1.0 (6)7.3 (45)7.7 (49)10.10 (70)
81978Richmond1.4 (10)2.8 (20)5.11 (41)9.16 (70)Hawthorn2.6 (18)6.9 (45)11.13 (79)14.15 (99)
31994Carlton3.1 (19)9.6 (60)13.12 (90)14.15 (99)Geelong2.4 (16)5.6 (36)6.7 (43)10.10 (70)
51997Essendon1.2 (8)2.5 (17)6.7 (43)10.10 (70)Collingwood3.9 (27)6.12 (48)8.14 (62)14.15 (99)
162002North Melbourne4.3 (27)7.6 (48)11.9 (75)14.15 (99)Port Adelaide2.4 (16)4.7 (31)10.10 (70)10.10 (70)
182018Essendon2.5 (17)4.11 (35)9.16 (70)14.15 (99)Fremantle4.0 (24)7.1 (43)10.4 (64)11.4 (70)
32022Melbourne3.5 (23)4.8 (32)9.12 (66)14.15 (99)Essendon0.4 (4)3.5 (23)8.5 (53)10.10 (70)
The fraction 97/56, similarly to the above, is sometimes used to approximate the square root of 3. There have been four “root 3 games”:
131977Collingwood2.7 (19)5.12 (42)9.16 (70)13.19 (97)North Melbourne3.2 (20)4.4 (28)5.4 (34)8.8 (56)
31983Fitzroy1.3 (9)6.9 (45)8.11 (59)14.13 (97)Essendon2.7 (19)5.7 (37)6.12 (48)7.14 (56)
141995Hawthorn1.3 (9)4.4 (28)6.7 (43)8.8 (56)West Coast2.4 (16)8.6 (54)11.10 (76)14.13 (97)
212009Collingwood2.3 (15)5.9 (39)10.13 (73)13.19 (97)Sydney0.4 (4)4.6 (30)6.7 (43)8.8 (56)
(It’s interesting that the first ever “root 3 game” would be a preview of the Grand Final!)

The fraction 161/72 is sometimes used for the square root of 5, but there has never been a VFL or AFL game with a final score of 161 to 72. The same is true for the fractions 218/89 and the less precise 49/20 for the square root of 6, and even multiples of the ratio 49:20 have not occurred although I thought that there must have been a game with a 98 to 40 score but I did not find one.

The rational approximation 127/48 for the square root of 7 has also never occurred as a VFL or AFL game score, nor has 199/60, which is very close to the square root of 11. However, there have been two “root 10 games” with a score of 117 to 37, both involving Hawthorn:
141976Footscray0.0 (0)2.2 (14)3.3 (21)5.7 (37)Hawthorn5.4 (34)9.6 (60)16.14 (110)17.15 (117)
151980Hawthorn1.5 (11)2.7 (19)3.8 (26)4.13 (37)Geelong6.4 (40)7.7 (49)14.14 (98)17.15 (117)
The rational approximate 63/50 for the cube root of 2 has occurred once, whilst its multiple 126/100 has occurred twice, for three “cube root of 2 games”:
121918St. Kilda4.3 (27)7.6 (48)8.8 (56)9.9 (63)Collingwood2.4 (16)4.6 (30)5.12 (42)6.14 (50)
41977Richmond4.3 (27)7.4 (46)12.9 (81)14.16 (100)Collingwood4.7 (31)9.11 (65)14.17 (101)17.24 (126)
22016Fremantle4.4 (28)6.7 (43)11.10 (76)14.16 (100)Gold Coast4.3 (27)11.6 (72)16.9 (105)19.12 (126)
The rational approximation 75/52 for the cube root of 3 has also occurred once, in Round 10 of 1953 when Fitzroy 11.9 defeated St. Kilda 7.10, whilst no score of 150 to 104 has ever occurred. The rational approximation 100/63 for the cube root of 4 has occurred six times:
21930Melbourne5.4 (34)7.9 (51)13.13 (91)14.16 (100)Geelong0.0 (0)3.7 (25)3.11 (29)8.15 (63)
101957Collingwood4.0 (24)10.4 (64)12.7 (79)14.16 (100)Carlton4.2 (26)4.5 (29)9.8 (62)9.9 (63)
171973Hawthorn4.2 (26)10.5 (65)14.7 (91)15.10 (100)Fitzroy2.1 (13)6.5 (41)7.7 (49)9.9 (63)
102004West Coast4.2 (26)5.6 (36)12.10 (82)14.16 (100)Richmond3.3 (21)5.6 (36)7.6 (48)9.9 (63)
92010Sydney3.2 (20)5.4 (34)8.5 (53)9.9 (63)Fremantle3.6 (24)9.12 (66)11.14 (80)14.16 (100)
232016North Melbourne3.1 (19)5.3 (33)6.8 (44)9.9 (63)Greater Western Sydney2.5 (17)6.8 (44)10.11 (71)14.16 (100)
The rational approximation 171/100 for the cube root of 5 has never occurred, nor has the rational approximation 193/71 for e. The approximation 71/123 for γ has occurred twice:
111948Footscray4.3 (27)6.5 (41)8.8 (56)10.11 (71)Collingwood3.2 (20)11.5 (71)13.7 (85)19.9 (123)
102013Geelong3.2 (20)6.6 (42)9.10 (64)18.15 (123)Gold Coast3.2 (20)4.8 (32)9.10 (64)10.11 (71)
The approximation 22/7 for π is the best-known rational approximation of an irrational number. It has never occurred as a “lowest-term” score, but multiples have occurred twice, including one of the most remarkable games ever played, with which those into statistics are bound to be familiar:
21909Fitzroy3.5 (23)4.7 (31)7.14 (56)12.16 (88)Geelong1.2 (8)2.7 (19)3.9 (27)3.10 (28)
131983Fitzroy8.4 (52)13.8 (86)24.11 (155)34.16 (220)North Melbourne2.2 (14)8.3 (51)10.5 (65)10.10 (70)
This unusual topic came to my attention when I realised that commonly used rational approximations for irrational numbers almost always use numbers that are typical scores in football games, so that it is highly plausible that they could occur as a match score.
 

(Log in to remove this ad.)

Remove this Banner Ad

Back
Top