- Moderator
- #1
Over the course of the Home and away season, the AFLW was attended by 263,308 at an average of 2,660, using 21.63% of available capacity. this includes the 23,085 that attended the Mens finals double header at the MCG in Round 2.This figure is up 1.63% on average, and 11.8% on aggregate with 9 extra matches.
Top 20 matches
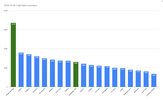
Thanks mostly to the MCG double header, the Dogs lead the home averages in this seasons AFLW.

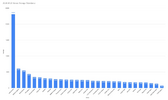
The MCGs lone match leads all comers for average attendance in the 2024 AFLW season. For venues that hosted more than one match, it was the Lions at Brighton Homes Arena that lead the way in 2024.

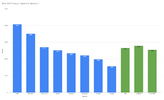
Friday night remains the most popular timeslot with fans averaging 4,070 through the turnstiles (boosted by the Friday night doubleheadere). Tuesday and Thursday had the lowest average attendance.If you take away the midweek games, as the AFLPA requested for benchmarking, you get an average of 2,796, if you take out the Friday night MCG Finals doubleheader, you get 2,549.

And for the hell of it, heres AFLW clubs home averages by venue.

Top 20 matches
| Round | Date | Day | Time | Home | Away | Venue | Attendance | Capacity | Cap% |
| 2 | 6/9 | Friday | 1630 | Western Bulldogs | Port Adelaide | MCG | 23,085 | 100,024 | 23.08% |
| 5 | 29/9 | Sunday | 1505 | Brisbane | Adelaide | Brighton Homes Arena | 6,104 | 10,000 | 61.04% |
| 8 | 19/10 | Saturday | 1605 | West Coast | Fremantle | Sullivan Logistics Stadium | 6,047 | 10,000 | 60.47% |
| 4 | 22/9 | Sunday | 1505 | Sydney | GWS | Henson Park | 5,530 | 20,000 | 27.65% |
| 1 | 30/8 | Friday | 1845 | Sydney | Collingwood | North Sydney Oval | 5,489 | 10,000 | 54.89% |
| 1 | 31/8 | Saturday | 1915 | Port Adelaide | Adelaide | Alberton Oval | 5,194 | 8,000 | 64.93% |
| 9 | 26/10 | Saturday | 1845 | Essendon | Richmond | TIO Stadium | 4,407 | 12,215 | 36.08% |
| 8 | 20/10 | Sunday | 1505 | Essendon | North Melbourne | Windy Hill | 4,336 | 5,000 | 86.72% |
| 10 | 3/11 | Sunday | 1635 | Port Adelaide | GWS | Alberton Oval | 4,148 | 8,000 | 51.85% |
| 7 | 11/10 | Friday | 1915 | Western Bulldogs | Essendon | Whitten Oval | 4,011 | 5,000 | 80.22% |
| 1 | 31/8 | Saturday | 1845 | Geelong | Melbourne | GMBHA Stadium | 3,838 | 40,000 | 9.60% |
| 1 | 1/9 | Sunday | 1435 | Brisbane | North Melbourne | Brighton Homes Arena | 3,395 | 10,000 | 33.95% |
| 5 | 27/9 | Friday | 1405 | Essendon | Melbourne | Windy Hill | 3,325 | 5,000 | 66.50% |
| 9 | 25/9 | Friday | 1915 | Adelaide | North Melbourne | Norwood Oval | 3,275 | 9,700 | 33.76% |
| 2 | 7/9 | Saturday | 1305 | Collingwood | Hawthorn | Victoria Park | 3,258 | 8,000 | 40.73% |
| 7 | 12/10 | Saturday | 1605 | Brisbane | Gold Coast | Brighton Homes Arena | 3,142 | 10,000 | 31.42% |
| 3 | 15/9 | Sunday | 1235 | Adelaide | Hawthorn | Thomas Farms Oval | 3,142 | 7,000 | 44.89% |
| 6 | 6/10 | Sunday | 1505 | Sydney | Geelong | Henson Park | 3,127 | 20,000 | 15.64% |
| 9 | 27/10 | Sunday | 1605 | Brisbane | Sydney | Brighton Homes Arena | 3,117 | 10,000 | 31.17% |
| 7 | 13/10 | Sunday | 1505 | St Kilda | Melbourne | RSEA Park | 3,073 | 8,000 | 38.41% |
Thanks mostly to the MCG double header, the Dogs lead the home averages in this seasons AFLW.

The MCGs lone match leads all comers for average attendance in the 2024 AFLW season. For venues that hosted more than one match, it was the Lions at Brighton Homes Arena that lead the way in 2024.

Friday night remains the most popular timeslot with fans averaging 4,070 through the turnstiles (boosted by the Friday night doubleheadere). Tuesday and Thursday had the lowest average attendance.If you take away the midweek games, as the AFLPA requested for benchmarking, you get an average of 2,796, if you take out the Friday night MCG Finals doubleheader, you get 2,549.

And for the hell of it, heres AFLW clubs home averages by venue.


